Student Project: Deutscher Ruderverband Statistics
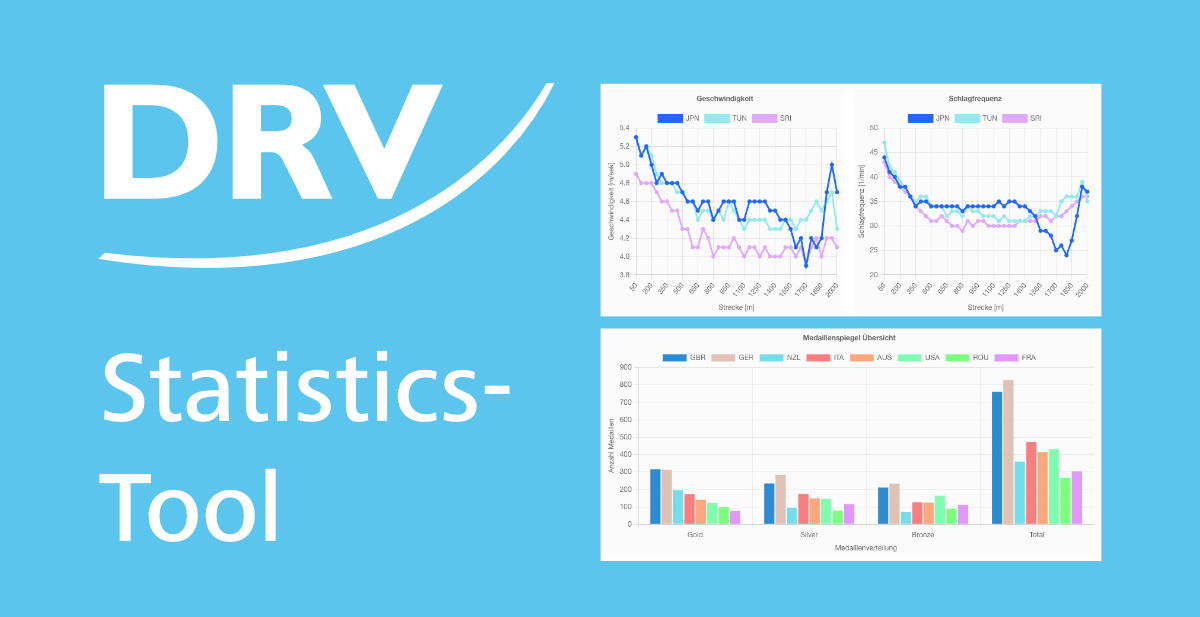
A statistical tool for analysis of historical data
Together with the German Rowing Association (Deutscher Ruderverband e.V., DRV in short), we built a tool for statistical analysis of historical data during the winter semester 2022/23. The tool with the name DRV-STATS can be accessed via the following link: https://drv-stats.up.railway.app.
The DRV already has a tool for statistical analysis of an existing database (https://u-row.de). Due to an interface change in the original datasource, the existing application could not be updated with up-to-date data since April 2020, and thus has been rendered useless. To solve this problem, the existing DRV tool should be recreated. The minimum requirement in this regard was the implementation of the currently implemented analysis functionality with integration of the current data.
What we wanted to achieve
The following implicit requirements were extracted in a follow-up meeting, after the initial kick-off.
- Setting up a state-of-the-art web application
- Ensure automated updates of historic data from the source
- Sustainability of the code and good documentation
- Cover most important use cases
- Report: make statistically valid statements about a boat class
- Race Structure Analysis: analyze specific races, supported by statistical values and graphical presentations
- Creation of an intuitive user interface
These minimal requirements were supposed to be fulfilled to allow athletes, trainers and sport analysts to examine historic data, break findings down and draw useful conclusions from them.
What did we achieve?
Together with the representatives from the DRV, Dr. Kay Winkert and Markus Last, we managed to fullfil all their requirements and more. We were able to continuously adjust according to their most recent feed and even bring in our own inputs and ideas.
Regarding the minimum requirements, we achieved to up their possible functionalities and allow for more complex analysis. Furthermore, we added 4 additional subpages which allow seeing the data from different perspectives.
The pages
Kalender (Calendar)
Link: https://drv-stats.up.railway.app/
The calendar is the start page of our service. It allows the user to scroll through a calendar and see past, current and upcoming events.
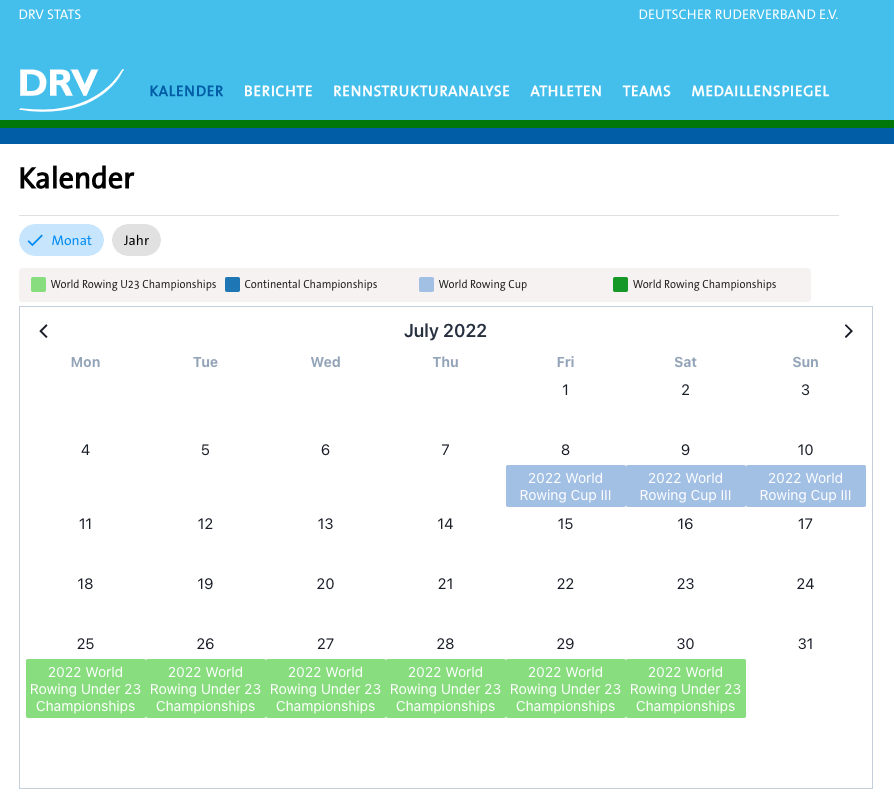
The whole data set covers the time range starting from a predefined date up until the next year. This means that upcoming events, if entered in our datasource, will be shown here.
Berichte (Reports)
Link: https://drv-stats.up.railway.app/berichte
This page provides a summary of travel times as a statistical measure over a defined period, by boat classes. Users can adjust relevant configurations using a filter. If data is available for the desired configuration, it is displayed in a table.
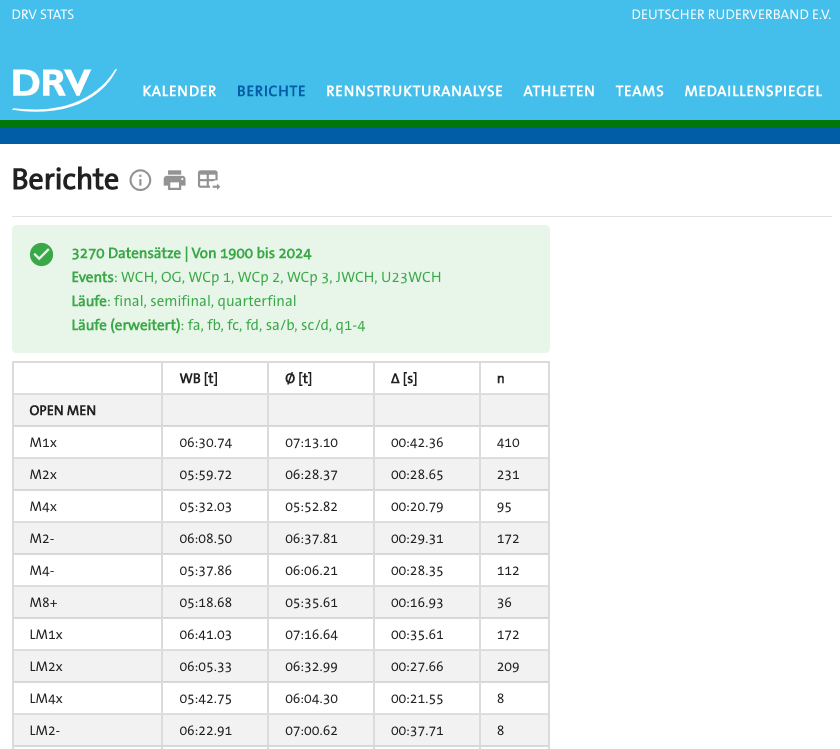
With the possible filters in place on this page, the user is capable of grasping a statistical summarisation of the possible sub-spaces enabled by the filters.
Rennstrukturanalyse (Race Structure Analysis)
Link: https://drv-stats.up.railway.app/rennstrukturanalyse
Selecting competitions implicitly by the filters, the user can traverse the inherent structure (Competitions > Events > Races) of the data to end up in a single race and get a detailed statistical analysis of set race.
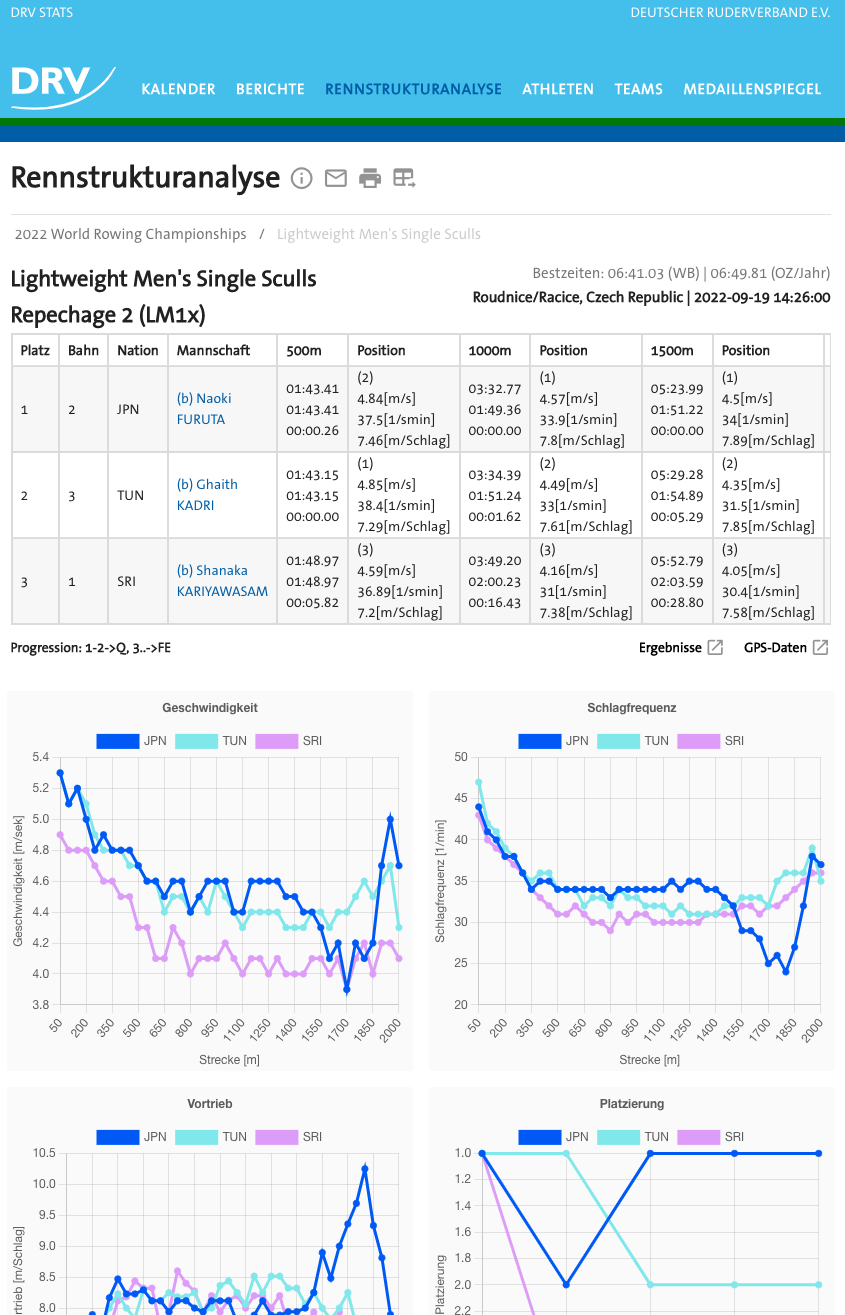
This allows the user to get into the depth of a single race by showing a statistical breakdown in numbers and graphs.
Athleten (Athletes)
Link: https://drv-stats.up.railway.app/athleten
Searching via name (first name or surname), the user is able to see all races that an athlete attended, with their respective placements within set races.
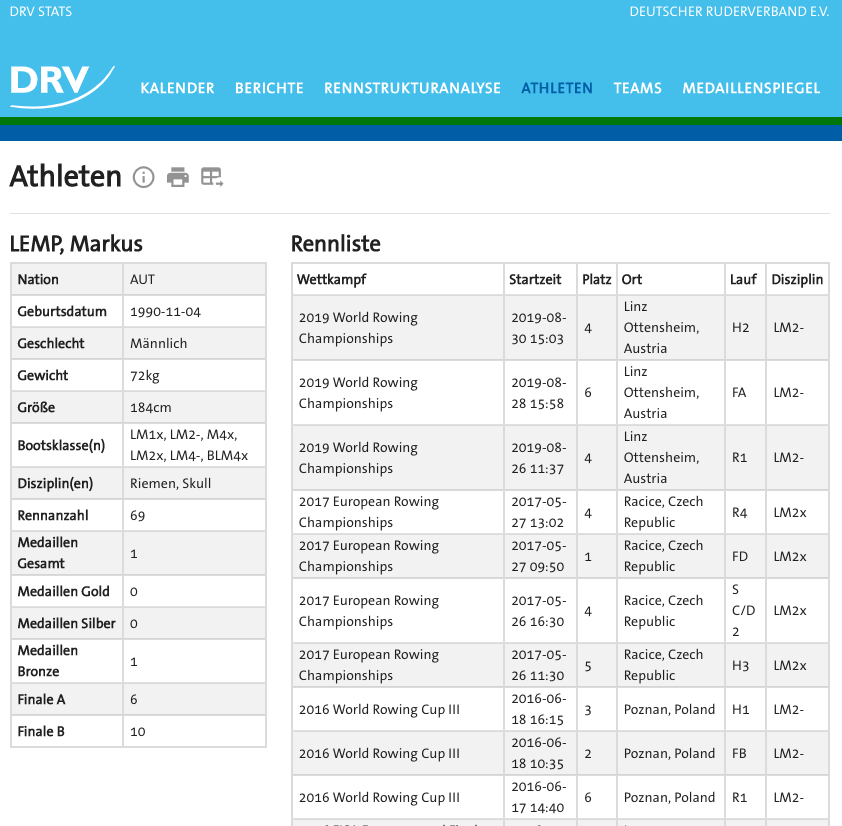
The user cannot only search athletes by their name. With our dynamic filter implementations in place, the user can filter the number of athletes by nation, year of birth, gender and boat class, to reduce the number of possible uncertainties.
Teams
Link: https://drv-stats.up.railway.app/teams
Filtering by year interval, nation and event category, like olympic games, world championship, etc., the user can see differing constellations of athletes, appearing by their names, grouped by category and their respective boat classes.
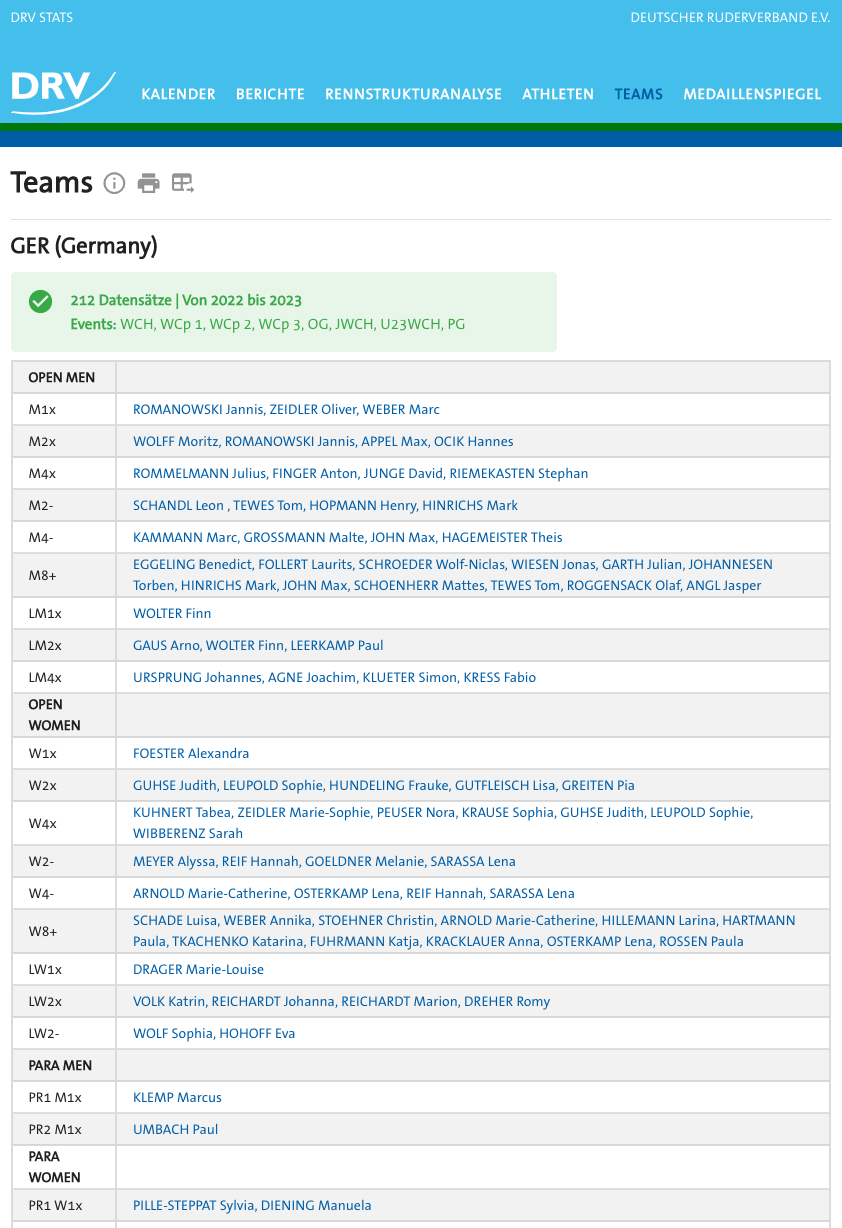
Other than that, clicking on an athletes name will transfer the user directly to the athletes-subpage, allowing him or her to get further insights on the selected athlete.
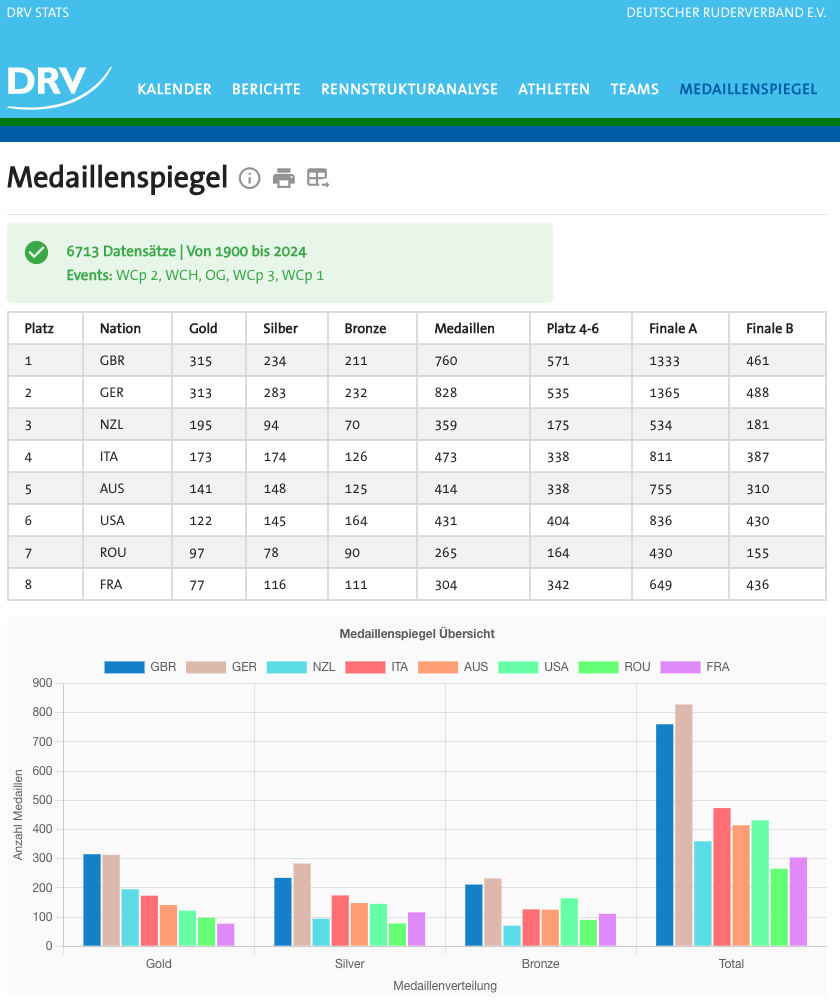
Medaillenspiegel (Podium Index)
Link: https://drv-stats.up.railway.app/medallienspiegel
This page allows the user to compare countries by their respective achievements, in dependence of the selected year and event-category. As a result, the user receives a listing, allowing a comparison of athletes placements in the resulting race types.
Data Aggregation, Architecture and Technologies
Data Aggregation
The data shown in our service originates from https://worldrowing.com/. With their JSON-API in place, we were able to reverse engineer and extract a cleaned dataset. By making calls to our wrapping worldrowing API, we would eventually receive data, competition by competition, for all of the original datasource records. For this, we had to try different approaches. To give an example:
Our request used to aggregate all relevant data of a competition, could have also been used on a list, instead of a single competition. This however was not possible, since the original API would not allow to respond with more than 1000 entities. As a result, we adjusted our API calls accordingly.
Outlier Handling
Extracted from PDFs and the worldrowing API, we had access to information like result times, the number of strokes and speed measured, depicted in different intervals. Based on the intervals (50m or 500m up to 2000m), the different types of competitions (Olympic Games, Paralympics, etc.) and the boat classes, we aggregated percentiles used to mark outliers.
Since the rowing data shows a strong left-skewed distribution, we could not apply outlier-markings like calculating the mean and creating a frame with the standard deviation around said mean, hence we used adjustable percentiles. Many official race results are present near the respective worlds best time, but way less results are present near the rear end of the data. To make solid statistical claims about a shown subset, especially the outliers at the higher end had to be removed.
Generally, we had to cover two different types, for which the marking of outliers was applicable:
- Race Data: number of strokes, meters per second in past 50m interval
- Result Data: time taken in past 500m interval
Architecture and Technologies used
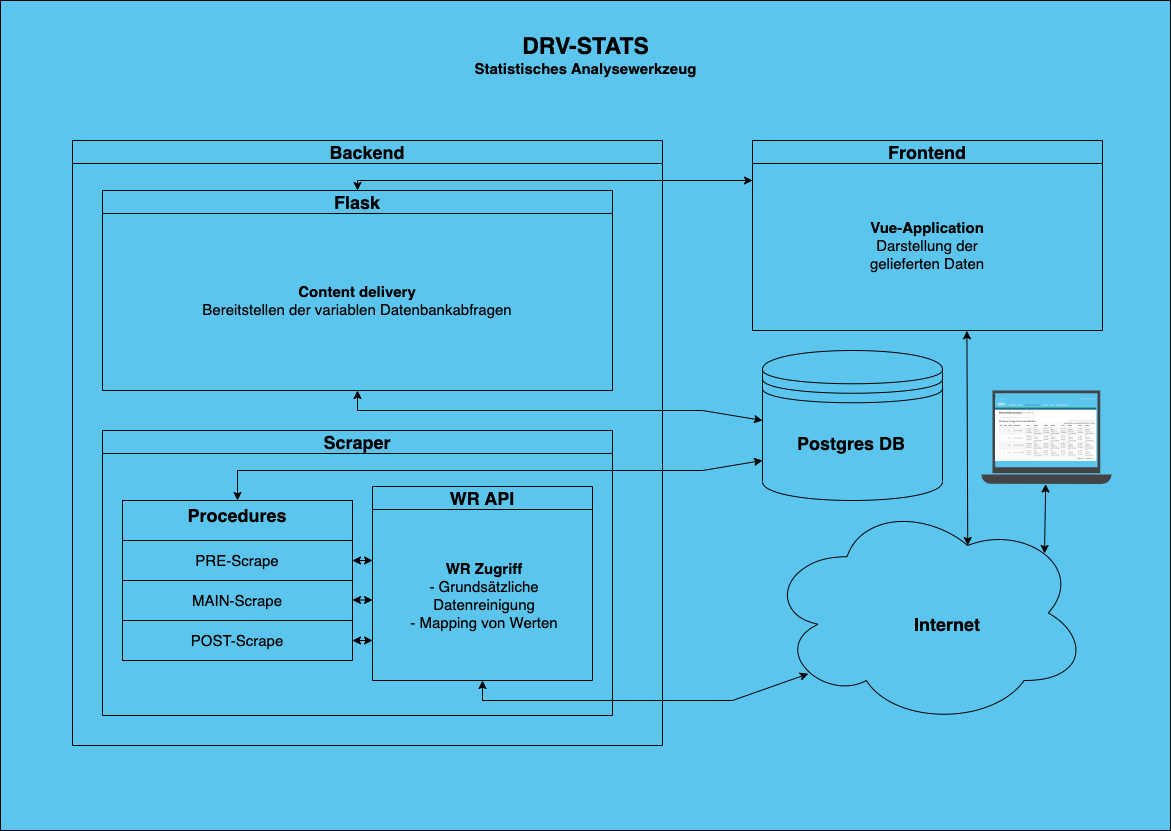
The backend architecture basically consists of four different components, which are communicating regularly to ensure the aggregation and provision of the data. The Vue.js frontend serves as the medium to display the data and as the user interface.
Flask
The Flask server connects the frontend and database, handling data aggregation for inquiries. It receives GET and POST requests with filter parameters from the frontend, translates them into SQL with SQLAlchemy and sends them to the Postgres database for processing.
Postgres Database
In the case of our service, the PostgreSQL database serves as our primary data storage for our internal data representation of the available data. As shown in the illustration above, the procedures write to the database and Flask reads from it.
World Rowing API
Functioning as a wrapper around the original datasource, our worldrowing API allows for efficient calls resulting in cleaned data, in the format that we need it in.
Procedures
The procedures are split into three routines:
- Pre: get minimum information about the competitions, in the timeframe of interest
- Main: gather information down the nesting, from competitions, to events, down to races. Here, the PDFs will also be processed and the information will be extracted
- Post: go over aggregated data and mark outliers
Thanks
First of all: Thanks to the reader who made it this far.
We are grateful to have been presented with the opportunity to create a service that will create constant value for the future of the DRV. A service that actually made it through the deployment phase and was released to the world.
So, a big thank you to Dr. Kay Winkert and Markus Last for giving us the opportunity. Ultimately, a big thank you to Prof. Dr. Johannes Maucher for trusting in our work and our process.